Never open the door to a lesser evil, for other and greater ones invariably slink in after it.”– Baltasar Gracian
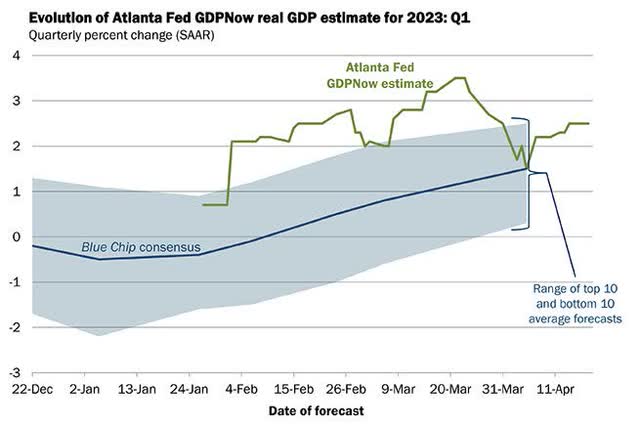
The stock market is entering another phase. I will decline to define what that might be because there are far too many conflicting signals that are confusing the picture. Suffice it to say the scene looks even more difficult for investors now. The bear market rally in stocks rolls on, as investors ponder what the Federal Reserve will do as they see declining headline inflation as a reason to celebrate. That keeps the drumbeat coming from the no-recession camp extremely loud. It seems the sanity of anyone that speaks about a recession is now being questioned. As of April 11th, many believed economic growth was going to be strong in the first quarter.
GDPNow (atlantafed.org)
As the chart indicates the Atlanta GDPNow tracker was forecasting Q1 coming in at 2.5%. The consensus was in the 1.6%-1.8% range. Those economists got a dose of reality with a Q1 GDP print of 1.1%.
All of this optimistic cheerleading is suggesting the investment scene is about to change into a safe and more secure situation. With the S&P challenging the February highs, it would appear much of that optimism is priced in. Not so fast. The BULLS are cheering bad news believing a bad economy slows down the Fed, and they are completely enamored by the talk of an actual Fed rate cut at the end of this year. Given that backdrop, corporate earnings will be resilient (this earnings season reflects that) against any lagged repercussions from policy tightening and will likely be up by as much as 10% from 2022’s level by mid-2024. That supports higher stock prices and justifies higher valuations.
All of that brings in FOMO (Fear of Missing Out) and squeezes all of those hedge funds that are “net short” in this equity market. Viola, the making of a continued rally that pushes the indices back to the old highs.
The Danger Zone
Others think that the equity market is about to enter a very dangerous phase. Inflation isn’t solved and investors can forget about lower rates anytime soon. Their Best Case” scene has interest rates staying higher for longer and instead of the Fed Funds rate at 5%-5.25% their worst case has Fed Funds ratcheting up to 6% and staying at that level for a long time. The bad economic data shouldn’t be cheered because it equates to bad corporate earnings. It’s getting harder to find an economic indicator that’s saying the economy isn’t already in a recession right now let alone on the verge of one. Therefore, the anticipation is for the U.S. economy to fall into a modest (best case), or a severe (worst case) recession later this year. Those who are in sync with this precarious phase say none of that is priced into this equity market. They question the sanity of those that describe the economy as “fine”, “resilient” or “strong”. If the economy is so strong why are bankruptcy filings in the first three months of 2023 the most in any first quarter since 2010?
ABI Executive Director Amy Quackenboss has the answer;
“The increase in bankruptcy filings in the first quarter of the year demonstrates the growing debt burdens of both consumers and businesses, as inflationary prices have increased in tandem with the cost of borrowing, struggling companies and households have access to a financial reprieve through the bankruptcy process.”
So the debate will rage on until the market finally settles the argument with a break of the trading range either up or down.
The Middle
Then there are several what I would call “Neutral” data points. Thy of course will be viewed differently depending on what market phase an investor believes is coming into play.
- The near-term technical situation as the rally is now challenging the long-term BEAR trend.
- Earnings are not as bad as expected.
- Light equity positioning by hedge funds is a catalyst that adds “Demand”
- There are alternatives to buying stocks to get a return.
- Cash on the sidelines
In the short term, financial conditions, while tightening, are far from extreme. The total household savings that everyone speaks about is dwindling due to the buildup of debt leaving what can be called “excess” a question mark. There are numerous risk-free alternatives available that offer attractive comparisons to owning stocks. No matter how rose-colored your glasses are, that reality suggests there is absolutely no guarantee that money comes into equities given the uncertainties that exist.
Investors are being challenged now. Stay with the BEAR trend, Get BULLISH, or do NOTHING. The latter often works well in times of uncertainty. Therefore, a “Neutral” setting where the momentum stocks and others that are in BULL markets are excellent ways to add or sustain “LONG” exposure. In the meantime, the use of Inverse ETFs can provide balance on the “SHORT” side. As mentioned last week, this “Neutral”, “Not sure” approach is very stressful and difficult to navigate. That is where the “Do Nothing” strategy comes in.
The Week On Wall Street
The major Indices opened the week on a positive note, but couldn’t hold onto any gains. Besides the headlines driving the near-term sentiment, overhead resistance remains formidable, and in the short term, the technical picture can trump everything else. Tuesday morphed into a selling event that signaled a reversal of fortune for the BULLS sending all of the indices to losses greater than 1%.
An inconsequential opening on Wednesday as traders waited for the Fed announcement. The holding pattern kept the indices in a narrow range, and after the Fed raised rates, the indices spent some time digesting the news and stayed in that range. Typically it always comes down to the last hour and today was no different, investors filtered through the news and Chair Powell’s press conference, then the sellers took over. The selloff wasn’t dramatic, but it was enough to push the other indices (except Russell 2000) to modest percentage losses.
Wednesday’s selloff carried over to the opening on Thursday and picked up momentum during the day sending the S&P to an intraday low of 4048. Similar to what occurred the week before, the index traded down to 4049, and buyers came in to defend that level. That late afternoon bounce lifted sentiment and a Friday rally ensued. While it erased some of the losses, except for the NASDAQ (+1.6%), it wasn’t enough to lift the major indices into gains for the week.
The FED
As expected the Fed increased the Fed funds rate by 25 basis points to 5-5.25%. The ensuing statement did not mention a pause and left the door open for the possibility of a hike in June. Chair Powell reiterated what he has said all along, the Fed is data-driven and will do everything necessary to quell inflation.
Nothing has changed – at least the way I have seen this situation play out. It’s all about inflation and it’s “higher for longer”.
The Economy
Employment
The U.S. jobs report revealed an eye-catching 253k April payroll rise, but it followed -149k in revisions that left a slightly weaker jobs path than expected. A flat workweek left a firm 0.2% April hours-worked rise. Hourly earnings rose by 0.5% to leave a 4.4% y/y gain, after boosts in both February and March. The jobless rate fell to a 54-year low of 3.39% from 3.50%. The labor force participation rate sustained the March rise to a 3-year high of 62.6%.
A Mixed bag in manufacturing.
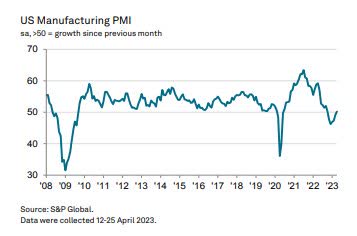
The seasonally adjusted S&P Global US Manufacturing Purchasing Managers’ Index posted 50.2 in April, up from 49.2 in March, and broadly in line with the earlier released ‘flash’ estimate of 50.4.
Mfg. PMI (pmi.spglobal.com)
The latest index reading was the first to post above the 50.0 neutral mark in the last six months and was the highest since October 2022.
The ISM manufacturing index ticked up 0.8 points to 47.1 in April, a little better than expected after falling 1.4 ticks to 46.3 in March. The latter was the lowest since May 2020 and the index remains in contraction since November, reflecting the slump in manufacturing in contrast to the expansion in the services sector. Most of the components improved with only three of the ten in negative territory.
Construction spending bounced 0.3% in April, better than forecast. However, it follows a 0.3% decline in February and a 0.2% slide in January. The downward revisions leave the report on the weak side.
Factory orders bounced 0.9% in March, a little shy of expectations, after falling 1.1% and dropping 2.1% in January. Transportation orders climbed 9.0% after sliding 3.2% previously. Excluding transportation, factory orders declined 0.7% from 0.7% (was -0.3%).
Services remain resilient
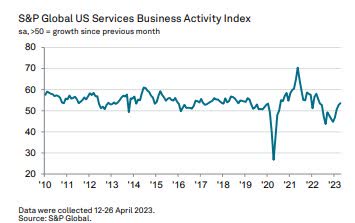
The seasonally adjusted final US Services PMI Business Activity Index registered 53.6 at the start of the second quarter, up from 52.6 in March and broadly in line with the earlier released ‘flash’ estimate of 53.7.
Services PMI (pmi.spglobal.com)
The latest data signaled the third successive monthly increase in output at service providers, with the rate of growth accelerating to the fastest for a year.
ISM services index edged up 0.7 ticks to 51.9 in April after falling 3.9 points to 51.2 in March. Except the 49.2 from December, the index has been above the 50 mark since 45.4 in May 2020. It was at an all-time peak of 67.6 in November 2021. The components were mixed.
Employment
JOLTS: job openings dropped 384k to 9,590k in March, a little below expectations, after declining 589k to 9,974k in February. This is the third straight monthly slice and is the lightest since April 2021. Openings were at 12,027k a year ago and compare to the record high of 12,027 in March 2022. There are 1.6 jobs available for every unemployed job seeker.
The Global Scene
This report may have set off the rally on Friday today as global fears of recession have dominated the headlines all week.
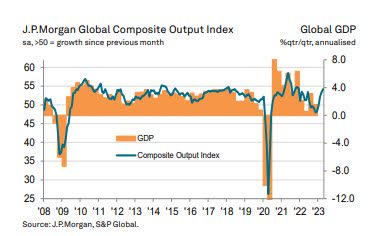
The J.P. Morgan Global Composite Output Index rose to 54.2 in April, up from 53.4 in March.
Global PMI (pmi.spglobal.com)
The headline index has remained above the neutral 50.0 mark – signaling expansion – in each of the past three months.
China manufacturing slows
China’s purchasing managers’ index for the manufacturing sector was 49.2 in April, down 2.7 points from last month. China’s PMI for the non-manufacturing sector was 56.4 in April, a continued expansion as policies in boosting consumption play out. The composite PMI, which includes both manufacturing and non-manufacturing activities, dropped from 57.0 to 54.4 in April.
The headline Caixin China General Manufacturing Purchasing Managers’ Index slipped from the neutral level of 50.0 in March to 49.5 in April.
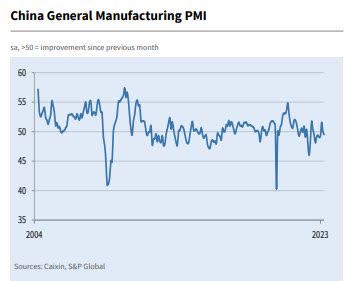
China Manufacturing PMI (pmi.spglobal.com)
This signaled the first deterioration in the health of the manufacturing sector for three months, albeit one that was marginal overall.
China’s Manufacturing PMI was disappointing but like most other countries ‘Services” were much better. Caixin China General Services PMI shows the service sector remained sharp in April. At 56.4 the headline Business Activity Index posted well above the neutral 50.0 level and pointed to a sharp increase in services activity across China. Although down from March’s reading of 57.8, it was the second-highest figure recorded since November 2020 and stretched the current sequence of rising activity to four months.
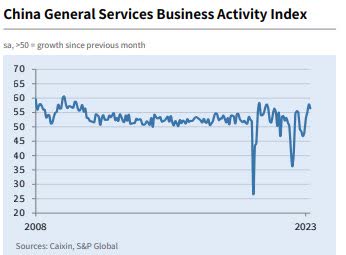
China PMI (pmi.spglobal.com)
Eurozone
The Euro area economy has grown at the most robust pace since May 2022 as the service sector rebound gathers momentum.
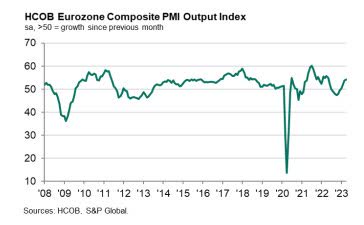
Euro Composite PMI (pmi.spglobal.com)
Key findings:
Composite PMI Output Index at 54.1 (Mar: 53.7). 11-month high.
Services PMI Business Activity Index at 56.2 (Mar: 55.0). 12-month high.
Input cost inflation slows to a 26-month low.
Canada
The seasonally adjusted S&P Global Canada Manufacturing Purchasing Managers’ Index posted 50.2 during April, up from March’s 48.6. Posting just above the crucial 50.0 no-change mark that separates growth from contraction.
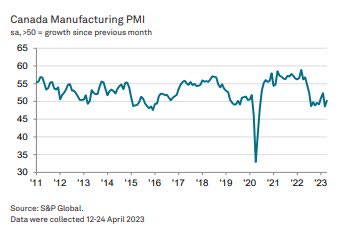
Canada Mfg. (pmi.spglobal.com)
The index signaled a marginal improvement in operating conditions since the previous month.
Japan
The headline au Jibun Bank Japan Manufacturing Purchasing Managers’ Index rose from 49.2 in March to 49.5 in April to indicate a sixth successive deterioration in the health of the Japanese manufacturing sector.
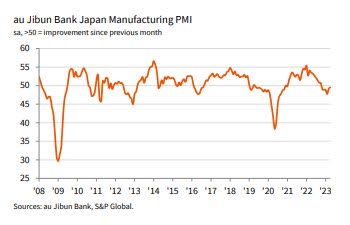
Japan Mfg. (pmi.spglobal.com)
The latest reading was only mild and the softest reduction in the sequence.
India Services PMI
Rising from 57.8 in March to 62.0 in April, the seasonally adjusted India Services PMI Business Activity Index signaled the fastest expansion in output since mid-2010. Anecdotal evidence linked the upturn to a pick-up in new business growth and favorable market conditions.
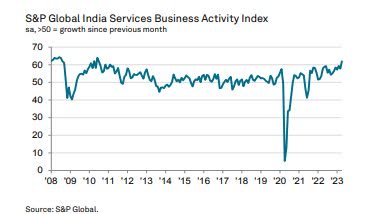
India Svcs. (pmi.spglobal.com)
Out of the four monitored sub-sectors, the strongest increase in output was seen in Finance & Insurance.
The Fed and the markets remain at odds with each other. The Fed funds futures continue to indicate the Fed will begin to cut rates aggressively starting in July, despite policymakers’ assertions that they will keep rates higher for longer. The hotter-than-expected core PCE report and ongoing banking concerns, even if it appears isolated to a few mismanaged banks, suggest this tug-of-war is likely to continue.
With tax season now mostly behind us, the Treasury market is getting increasingly concerned about the debt ceiling, particularly with the ‘x’ date approaching. Some unusual movements between 1-month and 3-month Treasury bills and credit-default swaps are catching the market’s attention.
There is mounting pressure for negotiations to begin, and then-Treasury Secretary Yellen’s updated her original view of mid-July for reaching the debt ceiling. She now proclaimed that the extraordinary measures keeping the US from defaulting “may be exhausted by June 1st”.
That got the attention of the White House prompting President Biden to finally negotiate by inviting leaders from both sides to meet on May 9th.
Earnings
We’ve seen the earnings reports and how they have easily beaten analysts. The calls for earnings “Armageddon” were incorrect, and perhaps we’ll see the weakness that was projected show up later in the year. Suffice it to say the reports have kept the indices resilient.
Earnings season for the S&P 500 is about halfway over now, and the index is on pace for a 3+% y/y decline in earnings. That is down from the 6% forecast coming into the year. If earnings growth does come in negative, it will be the second straight quarter in which a decline was experienced.
This Stat from FactSet is an eye-opener. The picture gets very curious when we remove Amazon from this quarter’s equation. Their earnings growth after a bad year last year is so large that without it, the S&P 500 earnings growth decline would drop to -5.1%.
Perhaps the analysts weren’t that far off in their original forecast after all. Moreover, current analyst estimates project a 5% earnings growth decline in the second quarter, so they do not expect earnings to pick up immediately.
The Daily Chart of the S&P 500 (SPY)
Four days of selling and another successful test of support was enough to turn the S&P around on Friday which ended the losing streak.
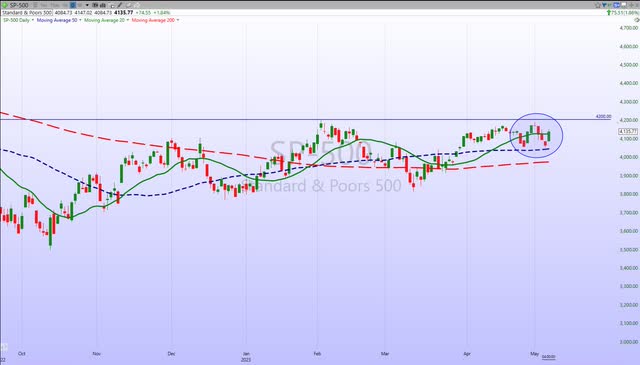
S&P 500 (tc2000.com)
In an EXACT replay of what we saw on April 26th, the S&P looked like it was ready to crater, only to rally and clear near-term resistance easily. The BULLS seem re-energized and will look to move the index back to once again test the 4200 range.
Investment Backdrop
Monthly Recap
What has historically been one of the best months of the year for stocks – April – is now in the rearview mirror. The month didn’t disappoint the BULLS when it comes to the major large-cap indices, with the S&P and DJIA posting gains. The NASDAQ was flat, while the Russell small caps wound up being the big loser.
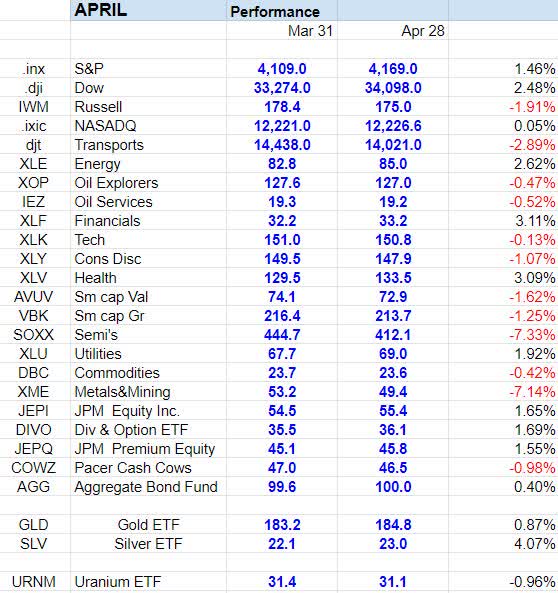
April Performance (seekingalpha.com)
Consumer Staples, Financials, and Health Care rose 3+% with Energy close by with a 2.6% gain. On the other hand, Metals and mining stocks were hit hard along with semiconductors. The latter gives back 7% of the Q1 gains.
YTD Recap
All of the major indices are in the black this year. The NASDAQ remains the frontrunner with a 16% gain.
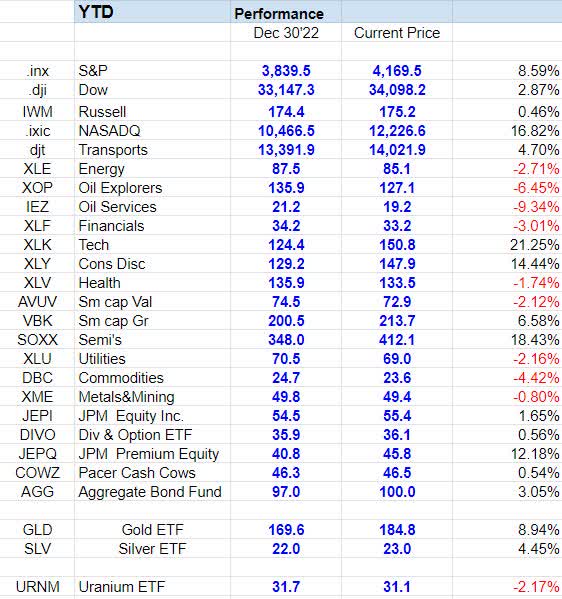
YTD Performance (seekingalpha.com)
For the year it’s been Technology and Consumer Discretionary. Within tech, the semiconductors are still holding onto a solid gain.
Strategy
As for me, I will continue to do what I always do, which is to make adjustments based on the balance of evidence and price action. I’m still working with the notion that the upside is limited. That doesn’t mean I have shut down all my positions completely, but particularly with earnings season here, in earnest, my focus has mostly been on finding opportunities with a momentum stock or two that offer decent set-ups.
When I reviewed the MONTHLY chart of the S&P 500 with members of my service recently, shows the index is up against resistance long-term resistance. The 20 MONTH moving average trend line has capped all rallies for the last 11 months. It’s no coincidence that this last rally stopped at the same levels.
A break and close above the trend line can start to change the narrative as it would be the first sign that the bear market is ending. I’ve mentioned this scenario before, and I’m giving what we experienced in 2015/2016 a good chance of occurring. It was a time when the S&P and other indices vacillated just above and just below the LT trend line. That kept most investors cautious and confused. At that time I stayed bullish, this time around I lean toward staying BEARISH as there are more obstacles for this market to overcome.
Right behind that option would be a failure at the resistance range that takes the index back into the trading range. In my view, the lowest probability would be another leg higher that eclipses the all-time high.
Bifurcated Market
Given the Up and Down-trendless market scene, there are just two types of situations. Stocks that are in confirmed BULL trends and stocks that are not. Since Q1’22 members of my service have been advised to avoid any situation that is NOT in a BULL trend unless they have a very long time horizon. There are no magic formulas when it comes to investing but placing probabilities in your favor is the first step to success. Anyone following that advice has fared better than the average investor.
The Savvy Investor continues to uncover these opportunities giving members an improved chance for success.
Small Caps
Small Caps continue to lag the overall market. The April lows in the (IWM) stopped short of the March lows as the index looks to be locked in a trading range. Unlike the other indices, the short-term trend lines are starting to roll over.
Unless we see a quick reversal higher, this chart could start to look even worse than it already does. There remains hope, but it’s easy to see this chart just does not look like the beginning of a new bull market. That’s not to say the other indices can’t move higher. We have seen plenty of bifurcation in the markets lately, but if we are on the cusp of an economic recovery and boom the small caps would be leading, not lagging.
Sectors
Energy
A wild ride for the Energy ETF (XLE) since March 1st. What looked like a breakdown, turned into a rally that now has the ETF in the middle of the trading range. That was until this past week and now it appears the ETF has completely broken down in the short term.
It is below all three short-term trend lines, but the long-term BULL trend is still in place. The sector is either presenting a good opportunity or is on the cusp of falling back into a BEAR market.
Financials
One word to describe the Financial sector -Breakdown. My message for the last couple of weeks has been the same- The group won’t be participating in any sustained market rallies for a while
The Regional Banks (KRE) made another low as expected. The recent trading pattern supported such a breakdown and I think there have been too many traders buying it in the hope that the bottom was in.
The ETF is a huge market barometer right now because I think if KRE breaks down, the small caps are likely to go with it and it’s hard to see much upside in the broad market if the small caps are not participating. It could even drag everything lower with it, so KRE is very much worth watching here.
After rallying off the March lows, the Financial ETF (XLF) which is comprised of the larger money center banks, insurers, etc.. faced another test of resistance and failed. I respect oversold bounces, but nothing that can be sustained as the downtrend lines will serve as solid resistance. Other than adding a position for the long term, this group remains in a BEAR market and is a no-touch.
Commodities
Gold
Two weeks ago we saw the rally slow, then stall in the Gold ETF (GLD). A narrow range ensued for 10 trading days, until another move higher on Tuesday. The 190-$195 range has been solid resistance going back to June 2020, and it held again as GLD sold off 1.9% on Friday.
Once again will see if the pullback is contained quickly. If GLD ever breaks above the multi-year resistance levels, it will kick off a BIG move higher.
Silver
Silver looked to be ready to break its short-term uptrend. The ETF (SLV) dipped below then back above the short-term uptrend line during the last week. It would not be so unusual if the ETF give back some of the recent gains as there is plenty of support below the current price.
Uranium
The Uranium ETF (URA) found support in the same range as it has in the past. For the moment has established a series of HIGHER lows, and is in a narrow trading range.
Healthcare
As the healthcare group was selling off during Q1, I remained steadfast in my opinion that the sector would rebound and produce opportunities during the year. That patience has paid off.
The selling event ended in March and the month of April was kind to the Healthcare sector (XLV). The ETF is back into the trading range and more importantly, the group is back in an LT BULL mode. Stocks in the sub-sector of Med Tech, like DexCom (DXCM), Intuitive Surgical (ISRG), and Stryker (SYK) continue to perform both fundamentally and technically. ISRG is at a 52-week high and SYK is at an all-time high. Those are home runs in a BEAR market.
Biotech
The Biotech ETF (XBI) rallied after a steep decline that stymied the BEAR to BULL reversal pattern we were tracking since last June. However, unlike the Healthcare group, Biotechs are up against long-term resistance and remain in a BEAR market. Given the uncertainty, it’s a difficult group to play right now. Savvy favorite (VKTX) is up 133% this year. Mirum Pharma (MIRM) has rallied 22% since its purchase in early March and is on the cusp of another breakout. These may not be for everyone, but one or two of these gems can make n investors year.
Technology
The NASDAQ formed a double top pattern in March and until the index can vault over and decisively close above the 12,300 level that pattern is still viable. Another situation that leaves investors guessing. The NASDAQ can either succumb to that bearish pattern or gather enough momentum to break above and keep the rally going. However, before anyone gets wildly bullish, the Index would then have to conquer the August high at 13,000. Simply stated the BEARISH trend is still dominant and the Technology group has plenty of work ahead to change that.
Semiconductors Sub-Sector
After the big Q1 rally, the Semiconductor ETF (SOXX) pulled back and reached a crossroads of sorts. This week’s action now shows the short-term trend lines rolling over and implies a potential retest of the April lows. The BULLS will look for that support level to hold. We’ll soon find out if the semis will regroup and be a leader or break down and test lower support.
Bitcoin
Even when you consider its volatile nature, bitcoin has had a notably strong six months, with its price almost doubling off the lows from last fall. The bulk of this rally occurred in the final months of 2022 and the first four months of 2023. However, there has been a moderate pullback in the last two weeks, as the rally lost momentum just as it was testing the 30,000 level. Over the past few days, bitcoin has been testing its 50-day moving average, which has held for now. If you are involved in crypto, it’s essential to watch this key level (~27,200).
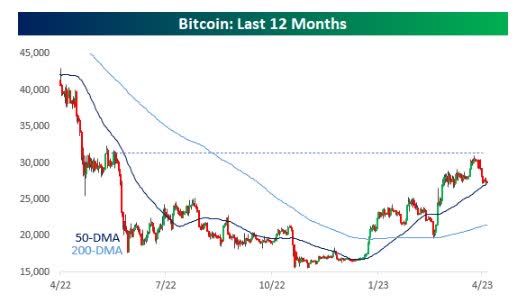
Bitcoin (bespokepremium.com)
Although bitcoin and the crypto space have little to do with the stock market, some traders monitor the space on the belief that they provide a good barometer of overall risk appetite. Trend changes in Bitcoin eventually bleed through to the equity market.
Final Thoughts
Analysts and economists keep showing up for their 10 minutes of “Air time” telling investors that the fixed-income market has been telling everyone the Fed has been “too tight” since last July. Really? The air supply in their soundproof padded rooms isn’t very good. These people are operating in a vacuum. A gentle reminder – inflation was running at 8.5% last July. Did anyone believe the Fed was going to slow down then? The pundits have already forgotten why the Fed is in the picture in the first place. We are now navigating a landscape situation as I described it in early 2022 – the WORST possible scenario.
The Fed enters the scene, not to tame a runaway economy (typical) but to fight inflation.
Add to that what was predicted to be a slowing economy and we have the recipe for nitroglycerin. Inflation is a plague, it is THE issue that can wreck an economy for a long time. The Fed wasn’t (last July) and isn’t going to back off on the fight so quickly. The constant banter about what the Fed should or should not be doing has been void of THE most important factor- Inflation. Unless the economy is cratering (it isn’t), then all else comes secondary to the inflation fight.
That is simply the way it is when it comes to high inflation. It is THE reason why this is the WORST scenario. The Fed doesn’t go away until inflation is killed. Economists and analysts speaking about what should be done with rates because of the banking issues (They are not Systemic) or the economy are missing the entire point of why the Fed is here. Anyone talking about the Fed being 100 basis points too tight today conveniently leaves inflation out of their commentary.
This is and always was a battle against inflation. Everything else is secondary. People are doing way too much cheerleading when it comes to the Fed regarding ending rate hikes and entertaining rate cuts today. That doesn’t mean we have to be overly pessimistic, but investors MUST recognize the reality of the situation and deal with it.
Unfortunately, that is just one of the “risks’ that are present. I continue to believe the risks are elevated and that there’s a lot that can potentially go wrong. Yes, some things could also go right, but I don’t believe the risks justify betting heavily on material upside until we start to see a clear change in the market’s behavior and profile. As I have written several times before, the move off of the October lows just hasn’t looked or felt to me like the beginning of a new bull market. The “technical” view backs up that assertion. I have been steadfast in my opinion that this is NOT a new BULL market. This can all change, but I am not ready to change my present strategy yet.
THANKS to all of the readers that contribute to this forum to make these articles a better experience for everyone.
Best of Luck to Everyone!
Read the full article here


